Exploring VKRP Growth Reports

Congratulations, teachers! It’s the end of the year, school is wrapping up, and VKRP assessments are complete. Now you may be wondering, how much did your students grow in mathematics, social skills, and self-regulation? VKRP Growth Reports can help you understand each student’s progress across the year.
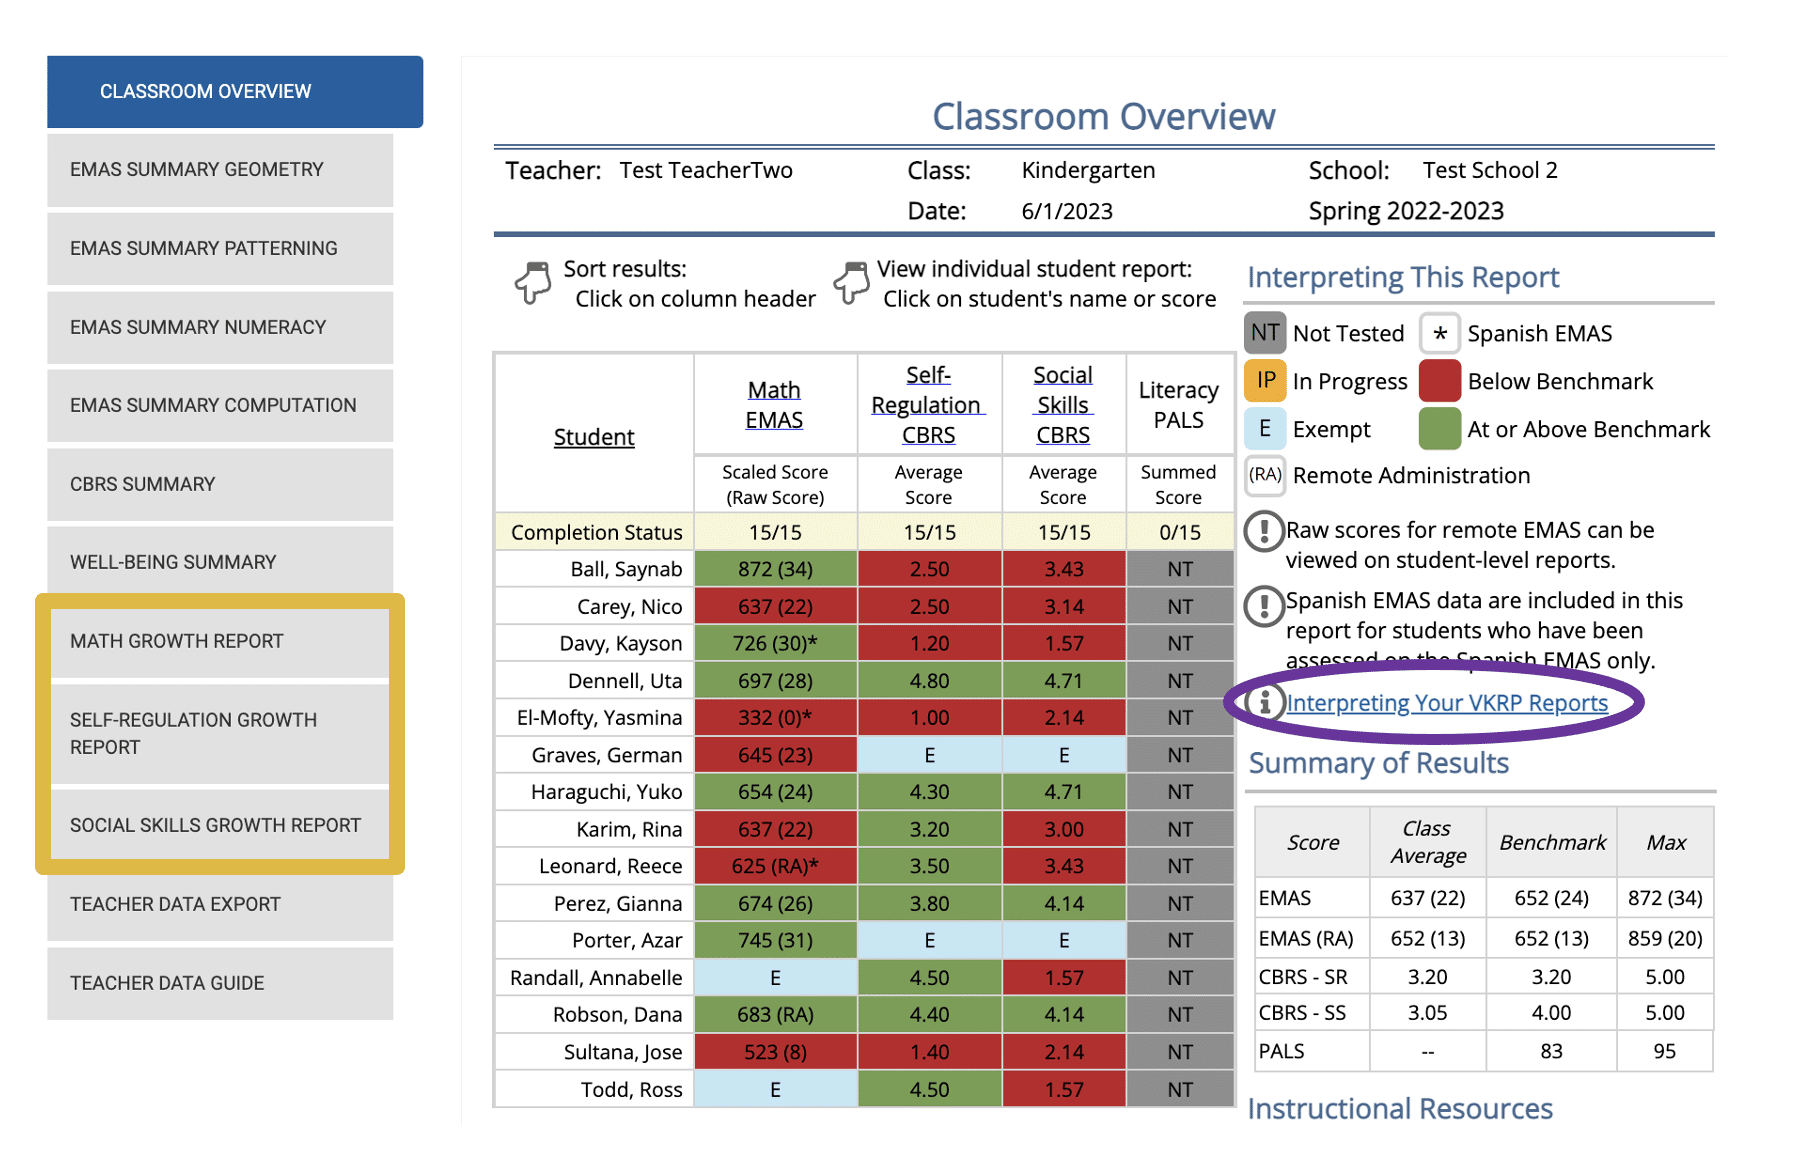
This post will orient you to the information you can find in the VKRP Growth Reports. Remember, more information is available in the Interpreting Reports document that you can download when you are logged into the VKRP portal. In the screenshot below, you can see where in the portal you can find your growth reports.

There are classroom– and student–level Growth Reports. The Pre-k and Kindergarten Growth Reports look a little different, so let’s start with kindergarten.
Kindergarten Growth Reports
For each of the VKRP sub-domains, mathematics, social skills, and self-regulation, the kindergarten Classroom Growth Reports give you four key pieces of information on each student: the student’s fall VKRP score, the student’s spring VKRP score, whether the student was above or below the benchmark in the fall, and whether the student was above or below the benchmark in the spring. The benchmark information is color-coded: green for above the benchmark, red for below. Combined, this information can help you understand how much each student gained across the year, and whether students are meeting minimal expectations for end-of-kindergarten skills.
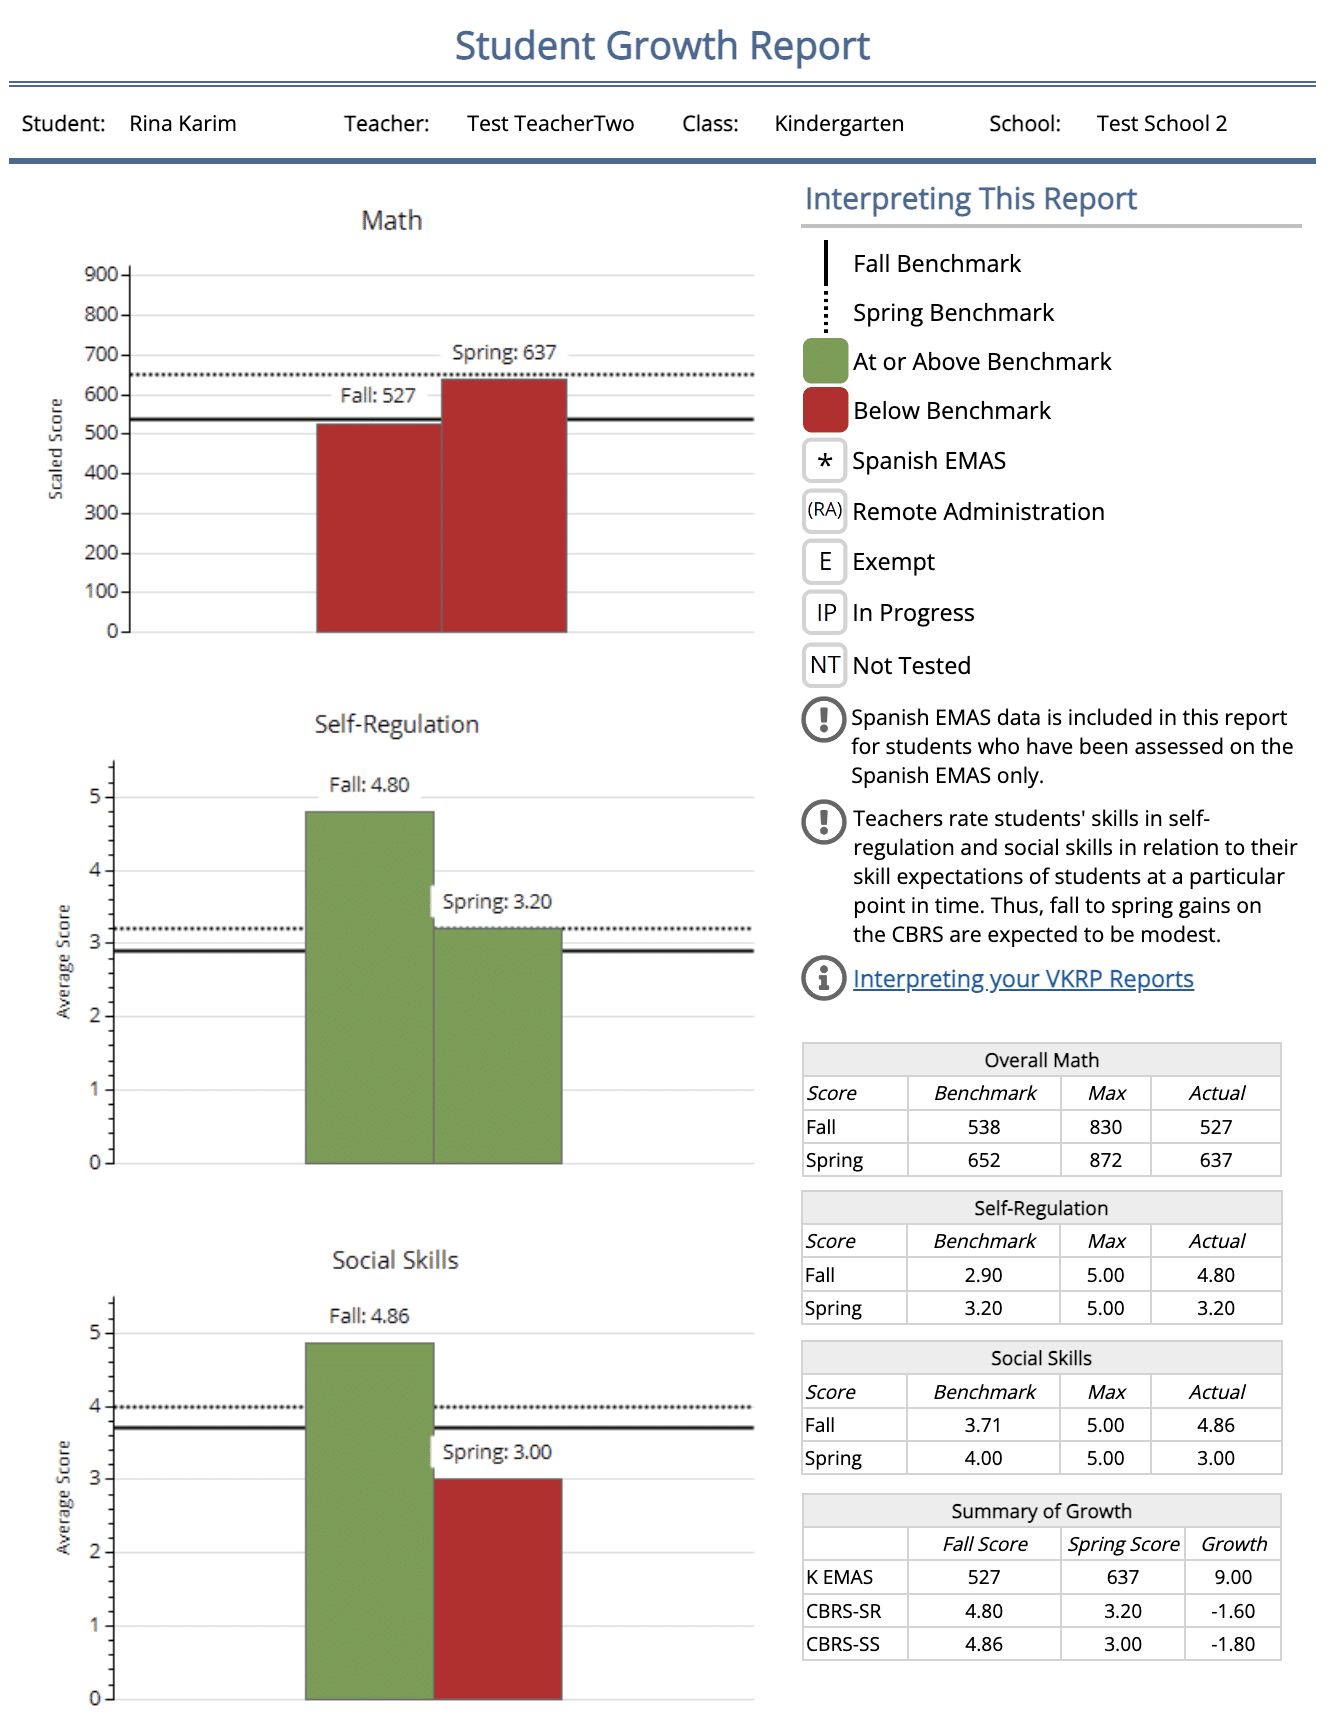
Click into the Student Growth Report (see example image below) and you can see results from all three sub-domains for each student on a single page. There is also a Summary of Growth table that shows each student’s growth from fall to spring.
Patterns of growth can be complex! Even if a student was below the benchmark in the fall and spring, they may have shown a lot of growth across the year. Students who start the year with higher scores often make smaller growth from fall to spring. This is common in our Virginia data and across the United States. Students who score at the top of the range for an assessment have less room to grow.

Pre-K Growth Reports
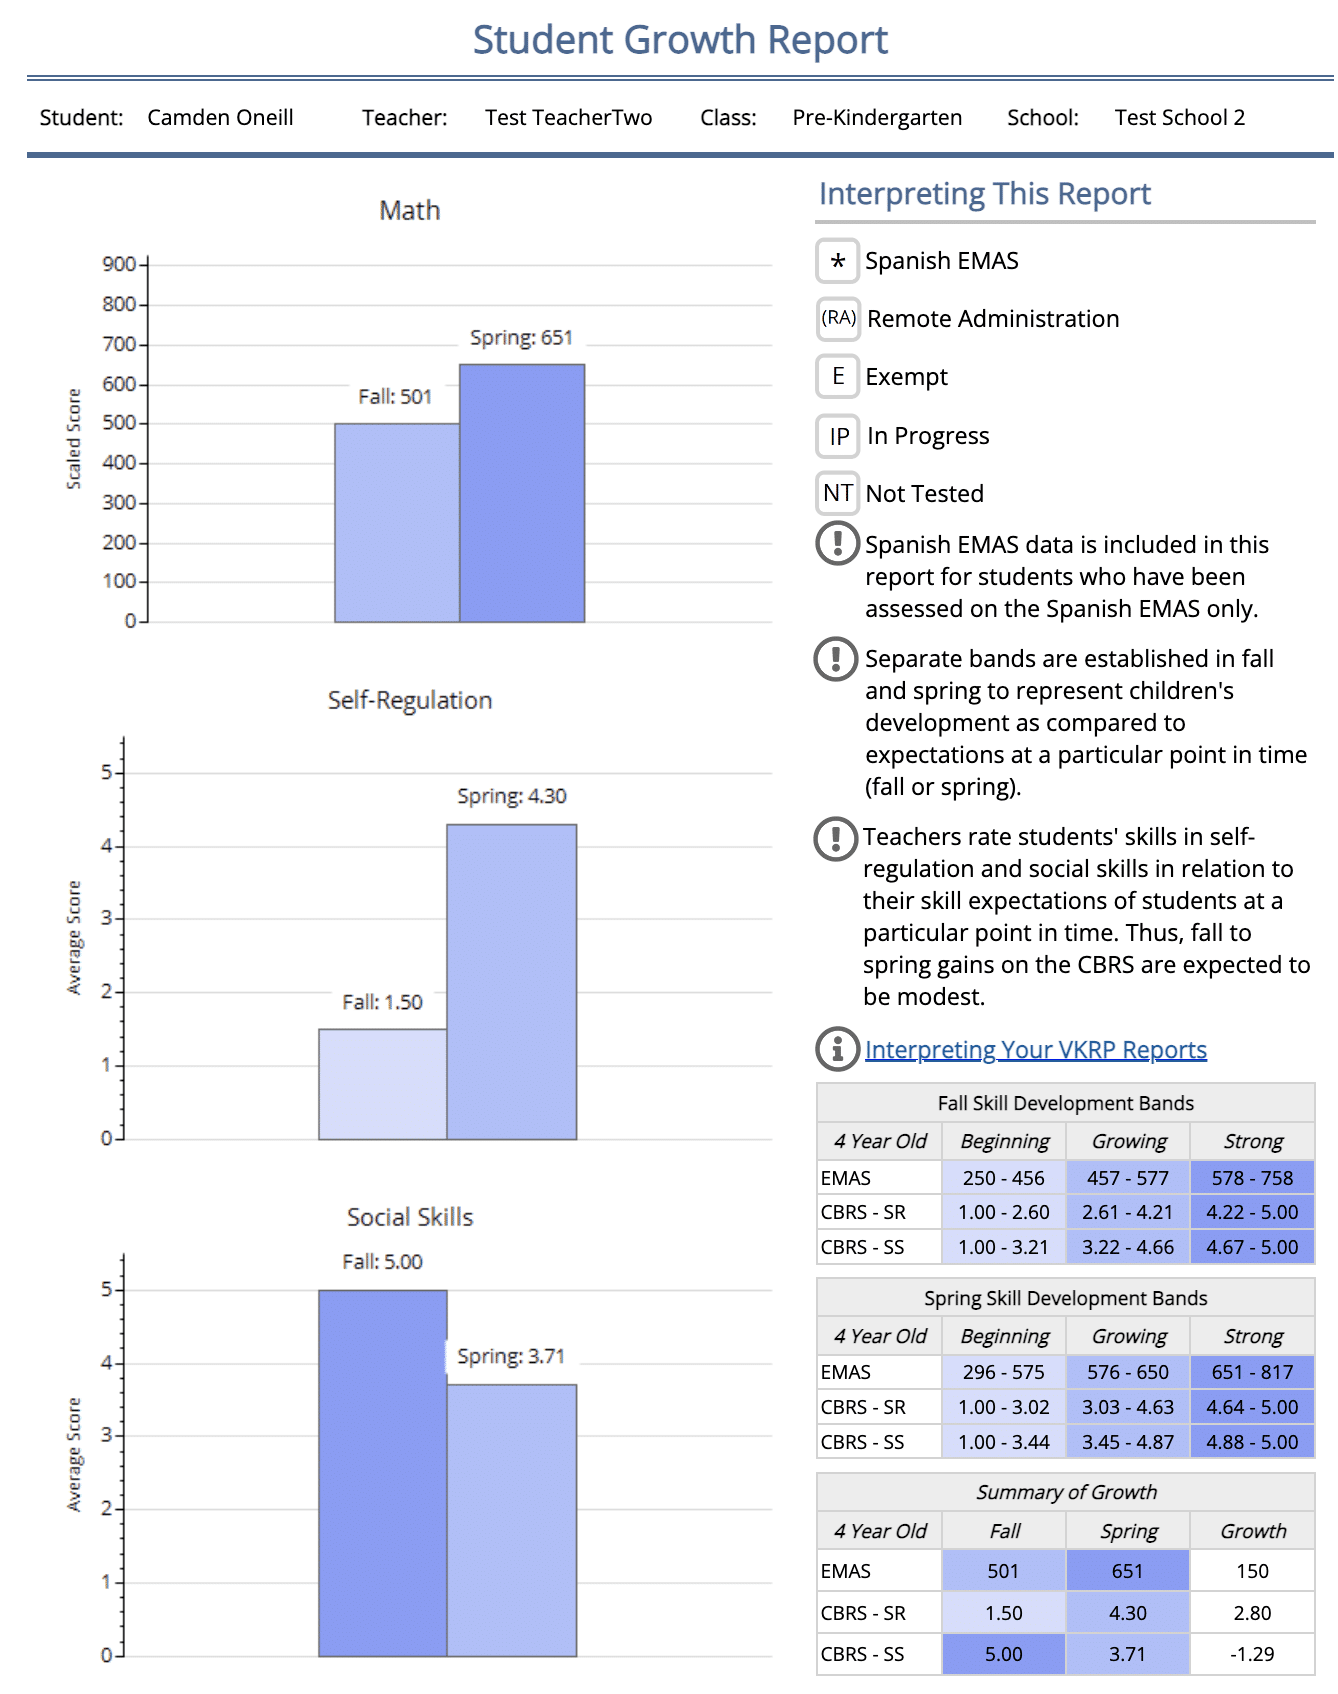
Just like kindergarten, the Pre-k Classroom Growth Reports show all children’s fall and spring scores on the mathematics, self-regulation, and social skills assessments. In pre-kindergarten, we use skill development bands instead of benchmarks. Skill development bands are score ranges that give guidance on where children are in their development so that teachers can provide appropriate support and instruction. The bands are different in fall and spring to show children’s development compared to expectations at each point in time. Therefore, we do not expect all children to be in the “strong” band by the end of the pre-k school year. The skill development bands are color-coded: light blue for “beginning”, medium blue for “growing”, and dark blue for “strong.”
The Pre-k Student Growth Reports (see example image below) show fall and spring scores on the mathematics, self-regulation, and social skills assessments on a single page for each child so that you can see each child’s subdomain scores altogether. There is also a Summary of Growth table that shows how children’s scores changed from fall to spring.
Children who end the year in the “Growing” band are right on track for kindergarten. Children in the “Strong” band are already meeting or exceeding some of the expectations for kindergarteners! Children in the “Beginning” band in the spring may benefit from extra support as they get ready to start kindergarten in the fall.

We hope that this orientation inspires you to dig into your growth reports and explore how your students grew from fall to spring!
More Questions for the VKRP Team? VKRP provides support via the online chat feature when you are in the system, via email vkrp@virginia.edu, and via toll free 866-301-8278