Look at All That Progress!
Exploring VKRP Spring Growth Reports

The end of the school year is approaching, and another VKRP spring term has come to an end! Thank you, Virginia educators, for your time and commitment throughout this school year.
One thing all early childhood educators love to see is how much their students change, grow, and develop throughout the year. VKRP Growth Reports can help you understand each student’s progress across the year.
In this week’s blog, we will showcase the information you can find in the VKRP Growth Reports. As a reminder, additional information can be found in the Interpreting Reports document, which can be found on the VKRP web portal.
Kindergarten Growth Reports
The Classroom-level Growth Reports show all students’ scores in mathematics, self-regulation, and social skills for fall and spring. The scores are represented by bar graphs labeled with “fall” and “spring” as well as each student’s score. With these two scores side-by-side, teachers can clearly see the progress students have made throughout the year. The benchmark information is color-coded: green for at or above the benchmark and red for below benchmark. Additionally, the fall benchmark is marked vertically by a solid black line and the spring benchmark is marked by a dotted line. Combined, this information can help teachers understand how much each student grew across the year and whether students are meeting developmental expectations for end-of-kindergarten skills.
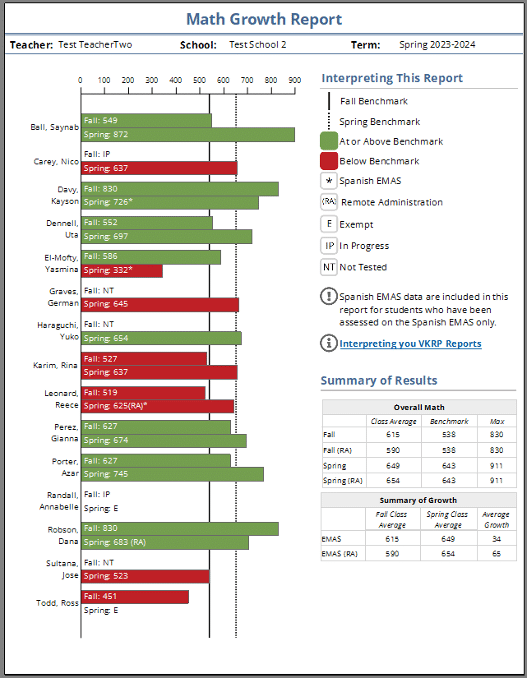
The K Student Growth Report is similar to the Kindergarten Classroom Report. However, it provides a more detailed representation of each individual student’s growth. Teachers can see how each individual student has grown in mathematics, self-regulation, and social skills.
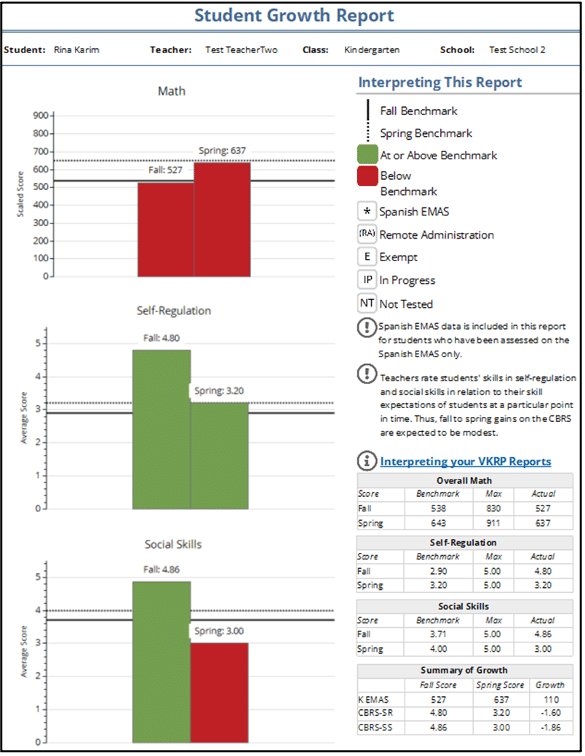
Patterns of growth can be complex! Even if a student was below the benchmark in the fall and spring, they still may have shown a lot of growth across the year. Students who start the year with higher scores often make smaller growth from fall to spring. This is common in our Virginia data and across the United States. Students who score at the top of the range for an assessment have less room to grow.
Pre-kindergarten Growth Reports
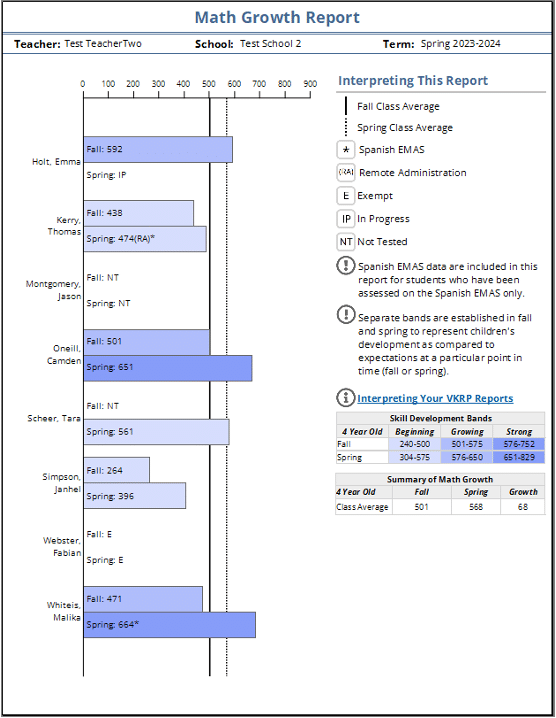
At the pre-kindergarten level, there are different reports for three-year-old and four-year-old children. In Pre-kindergarten Growth Reports, Skill Development Bands are used instead of benchmarks. VKRP Skill Development Bands are score ranges that give guidance on where children are in their development so that teachers can provide appropriate support and instruction. The VKRP Skill Development Band ranges are different in fall and spring to show children’s development compared to expectations at each point in time. Therefore, we do not expect all children to be in the “strong” band by the end of the pre-kindergarten school year.
On the Pre-kindergarten Classroom-level Growth Report shown below, children’s scores are represented by bar graphs that are labeled with “fall” or “spring” and the child’s score. The bars are color-coded based on whether the child’s scores put them in the beginning, growing, or strong category. The fall class average is represented by a solid vertical line, and the spring class average is represented by a dotted vertical line.
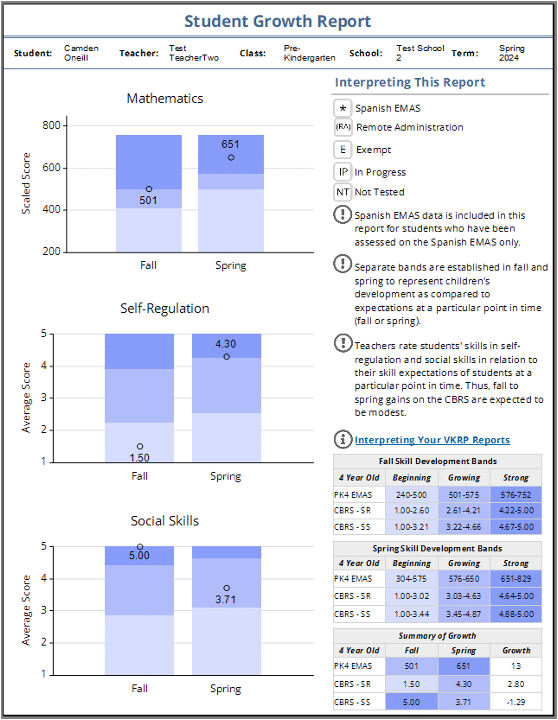
The Pre-kindergarten Student-level Growth Report is similar to the Classroom-level Report. However, it provides a more detailed representation of an individual child’s growth. The VKRP Skill Development Bands are shown in color: the lightest shade for “beginning,” a slightly darker shade for “growing,” and the darkest shade for “strong.”
The Pre-k Student Growth Reports below show all fall and spring scores for mathematics, self-regulation, and social skills assessments on a single page for each child so that you can see each child’s subdomain scores altogether. There is also a Summary of Growth table that shows how children’s scores changed from fall to spring.
Pre-kindergarten Family Reports
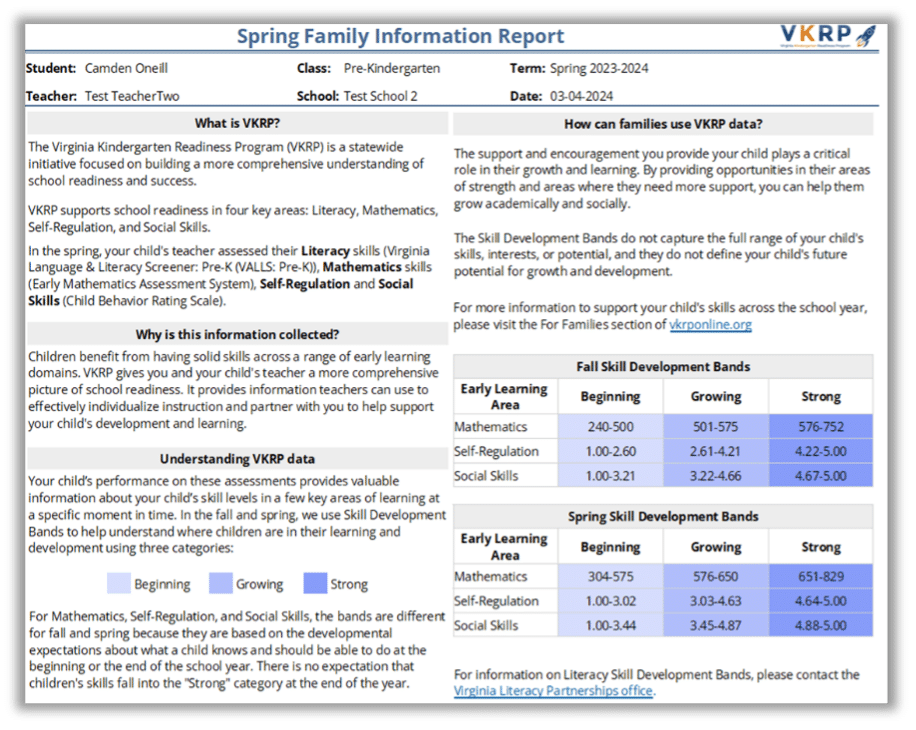
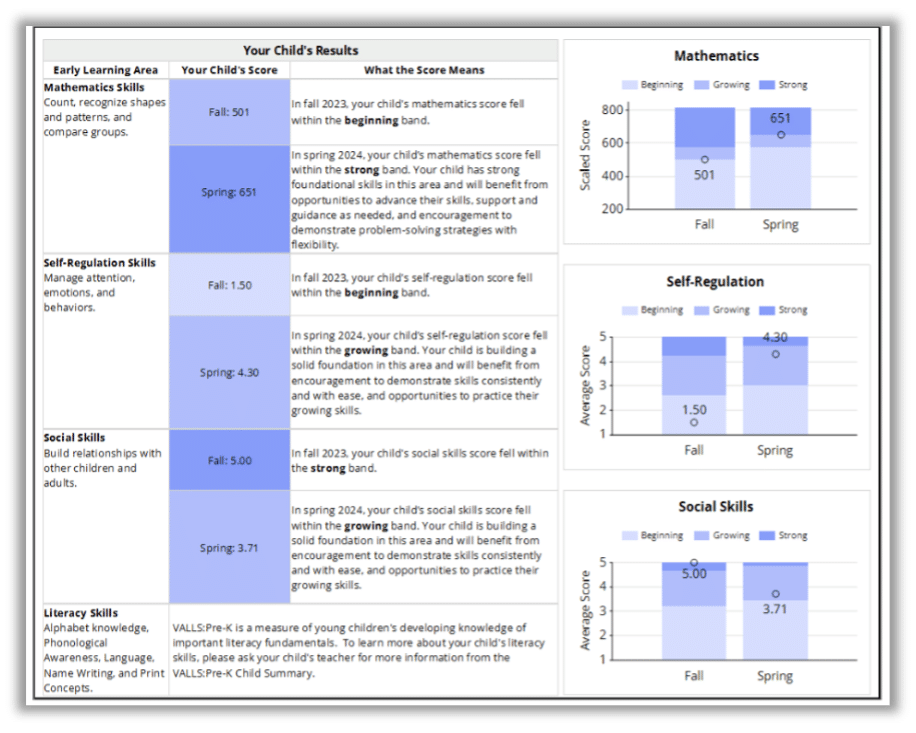
This spring, the VKRP team has created a new version of the VKRP Family Information Reports for pre-kindergarten. Throughout the past year, VKRP and the Virginia Department of Education team members engaged with families and incorporated their feedback in the new Pre-kindergarten Family Information Report. The revised report is two pages long and now includes information about the fall and spring VKRP Skill Development Band groups. The report provides a comprehensive overview of children’s performance. The revised report includes children’s results from fall and spring on the EMAS and CBRS. Additionally, to offer a clearer picture of progress, we have introduced growth charts that visually represent how children’s scores changed from fall to spring.
We hope that you find these new Pre-kindergarten Family Information Reports as a valuable resource when communicating with families about their child’s progress over the course of the year! The VKRP Team is also working on revisions to the Kindergarten Family Information Reports that will incorporate score bands, so be on the lookout for those in the future!
For more information on these and other reports, don’t forget to check out the Spring Interpreting Reports for both pre-kindergarten and kindergarten educators! The Interpreting Reports document includes an overview of all the available classroom and student reports as well as how to access and interpret these reports. It also includes suggestions on how to use VKRP data to reflect on instruction and utilize carefully vetted VKRP resources.
The Interpreting Reports document is located on the VRKP web portal under Reports > Understanding Reports.

It is amazing how much change occurs over the course of one school year! We hope that you utilize the VKRP Growth Reports to see evidence of this change for your students this year and for years to come!
More Questions for the VKRP Team? VKRP provides support via the online chat feature when you are in the system, via email vkrp@virginia.edu, and via toll free 866-301-8278